Figure 3. | Cone-beam computed tomography scans 6 months after grafting procedure. |
.jpg "View Figure")
.jpg "View Figure")
.jpg)
.jpg "View Figure")
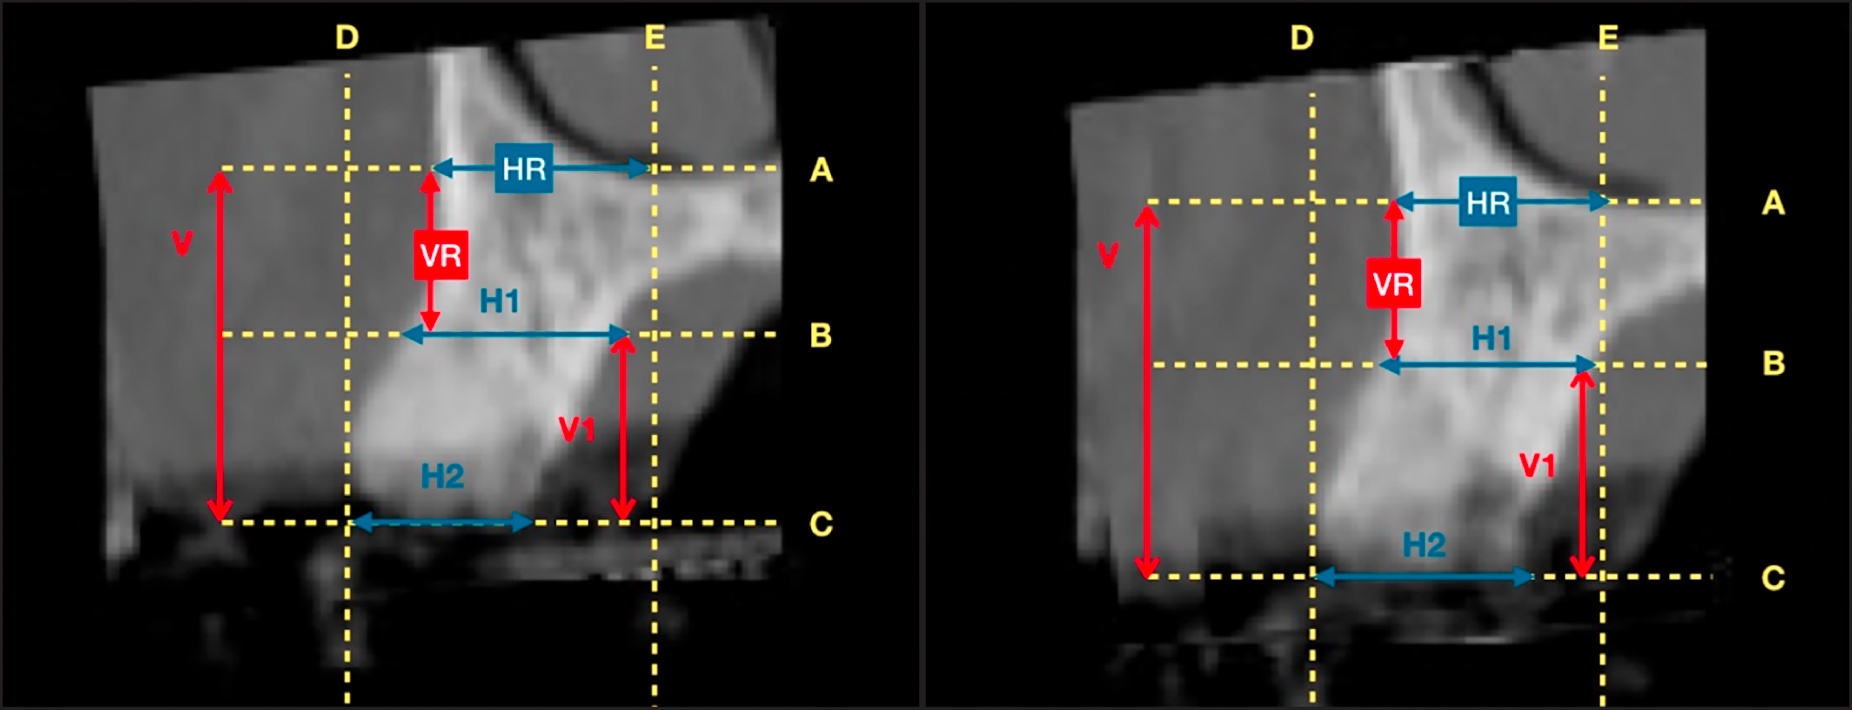
A = line drawn at the level of the maxillary sinus floor;
|
Figure 3. | Cone-beam computed tomography scans 6 months after grafting procedure. |
A = line drawn at the level of the maxillary sinus floor;
|