Figure 2. | Mandibular foramen: position, shape and area. |

Figure 1
Figure 2
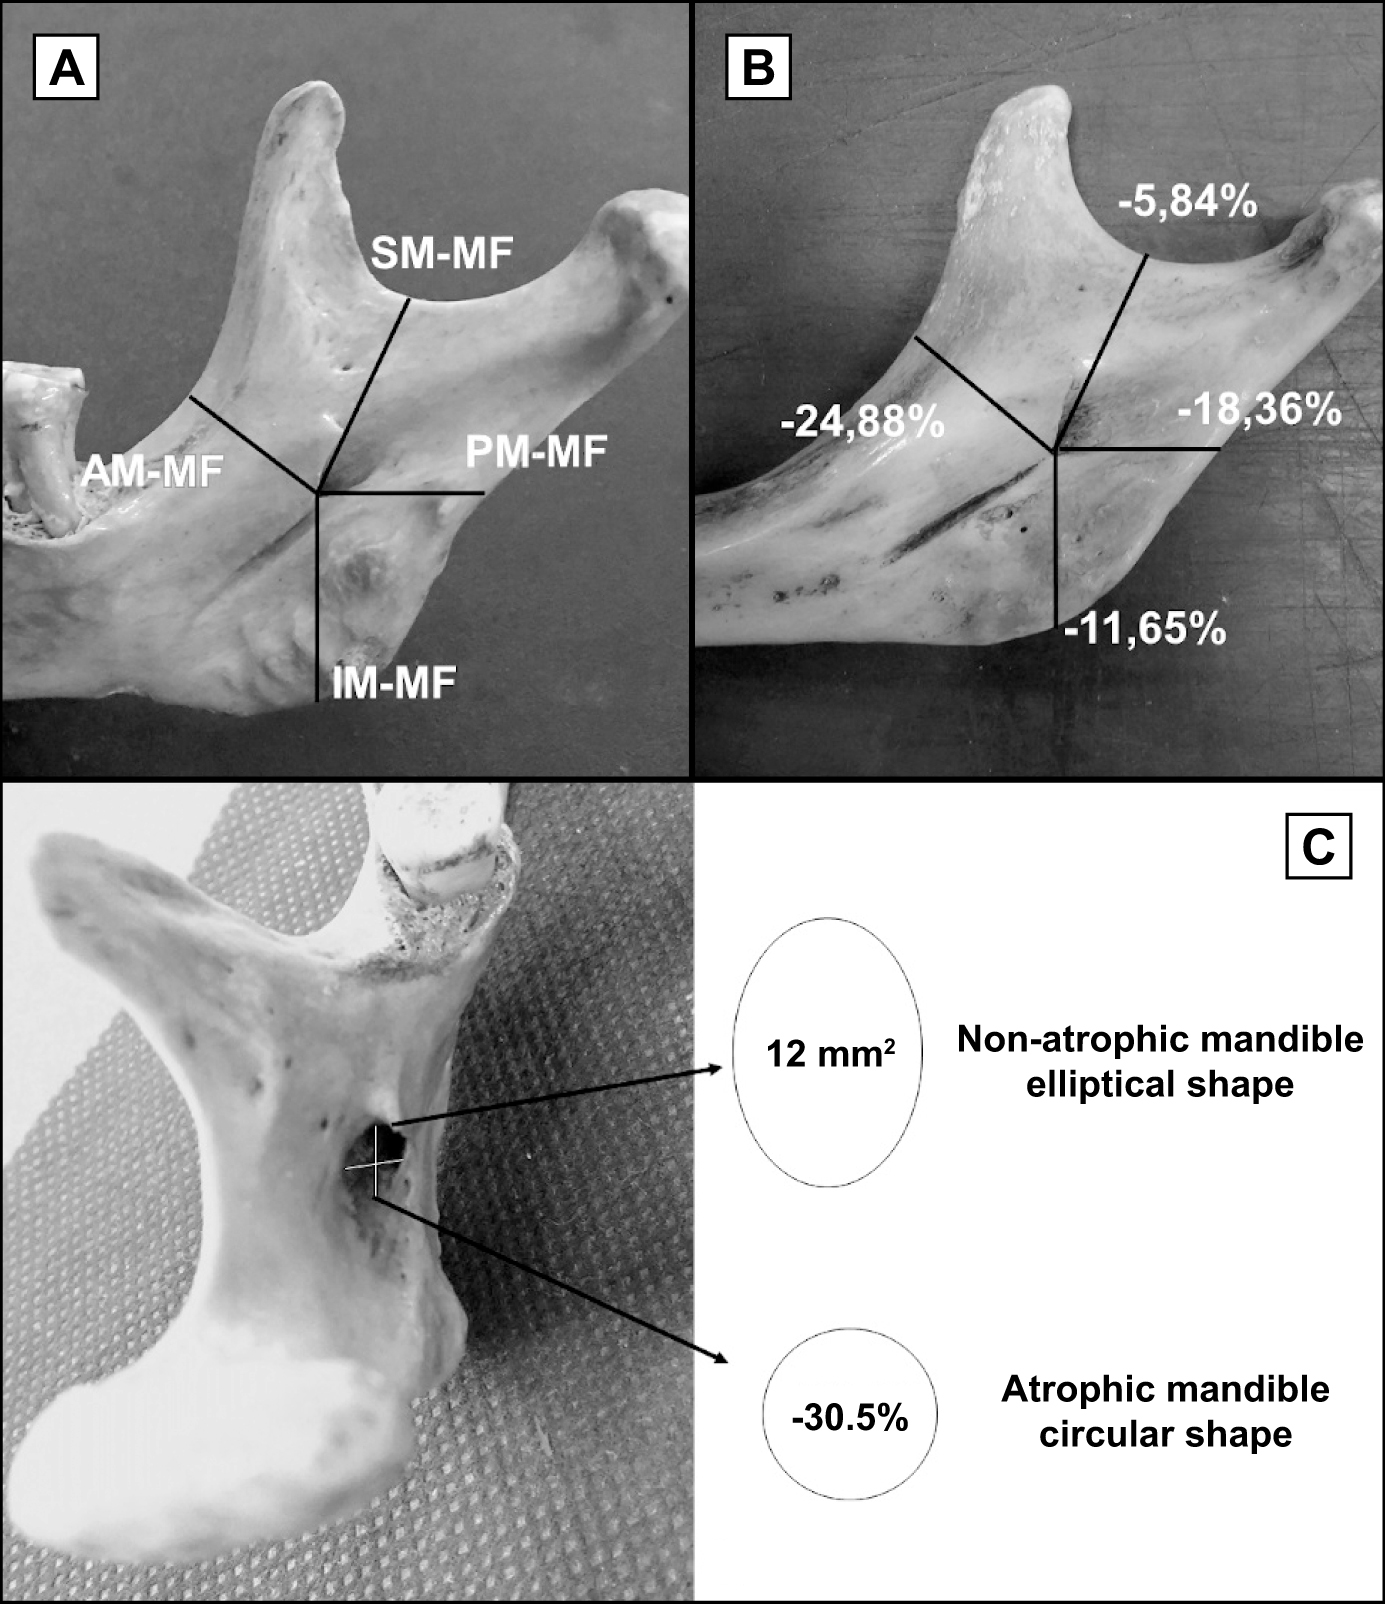
A = Position of the mandibular foramen to specific points of the ramus in a non-atrophic mandible; B = Average decrease of the measurements in an atrophic mandible; C = Representation of the shape of the foramen in both groups and average decrease of its area.
|