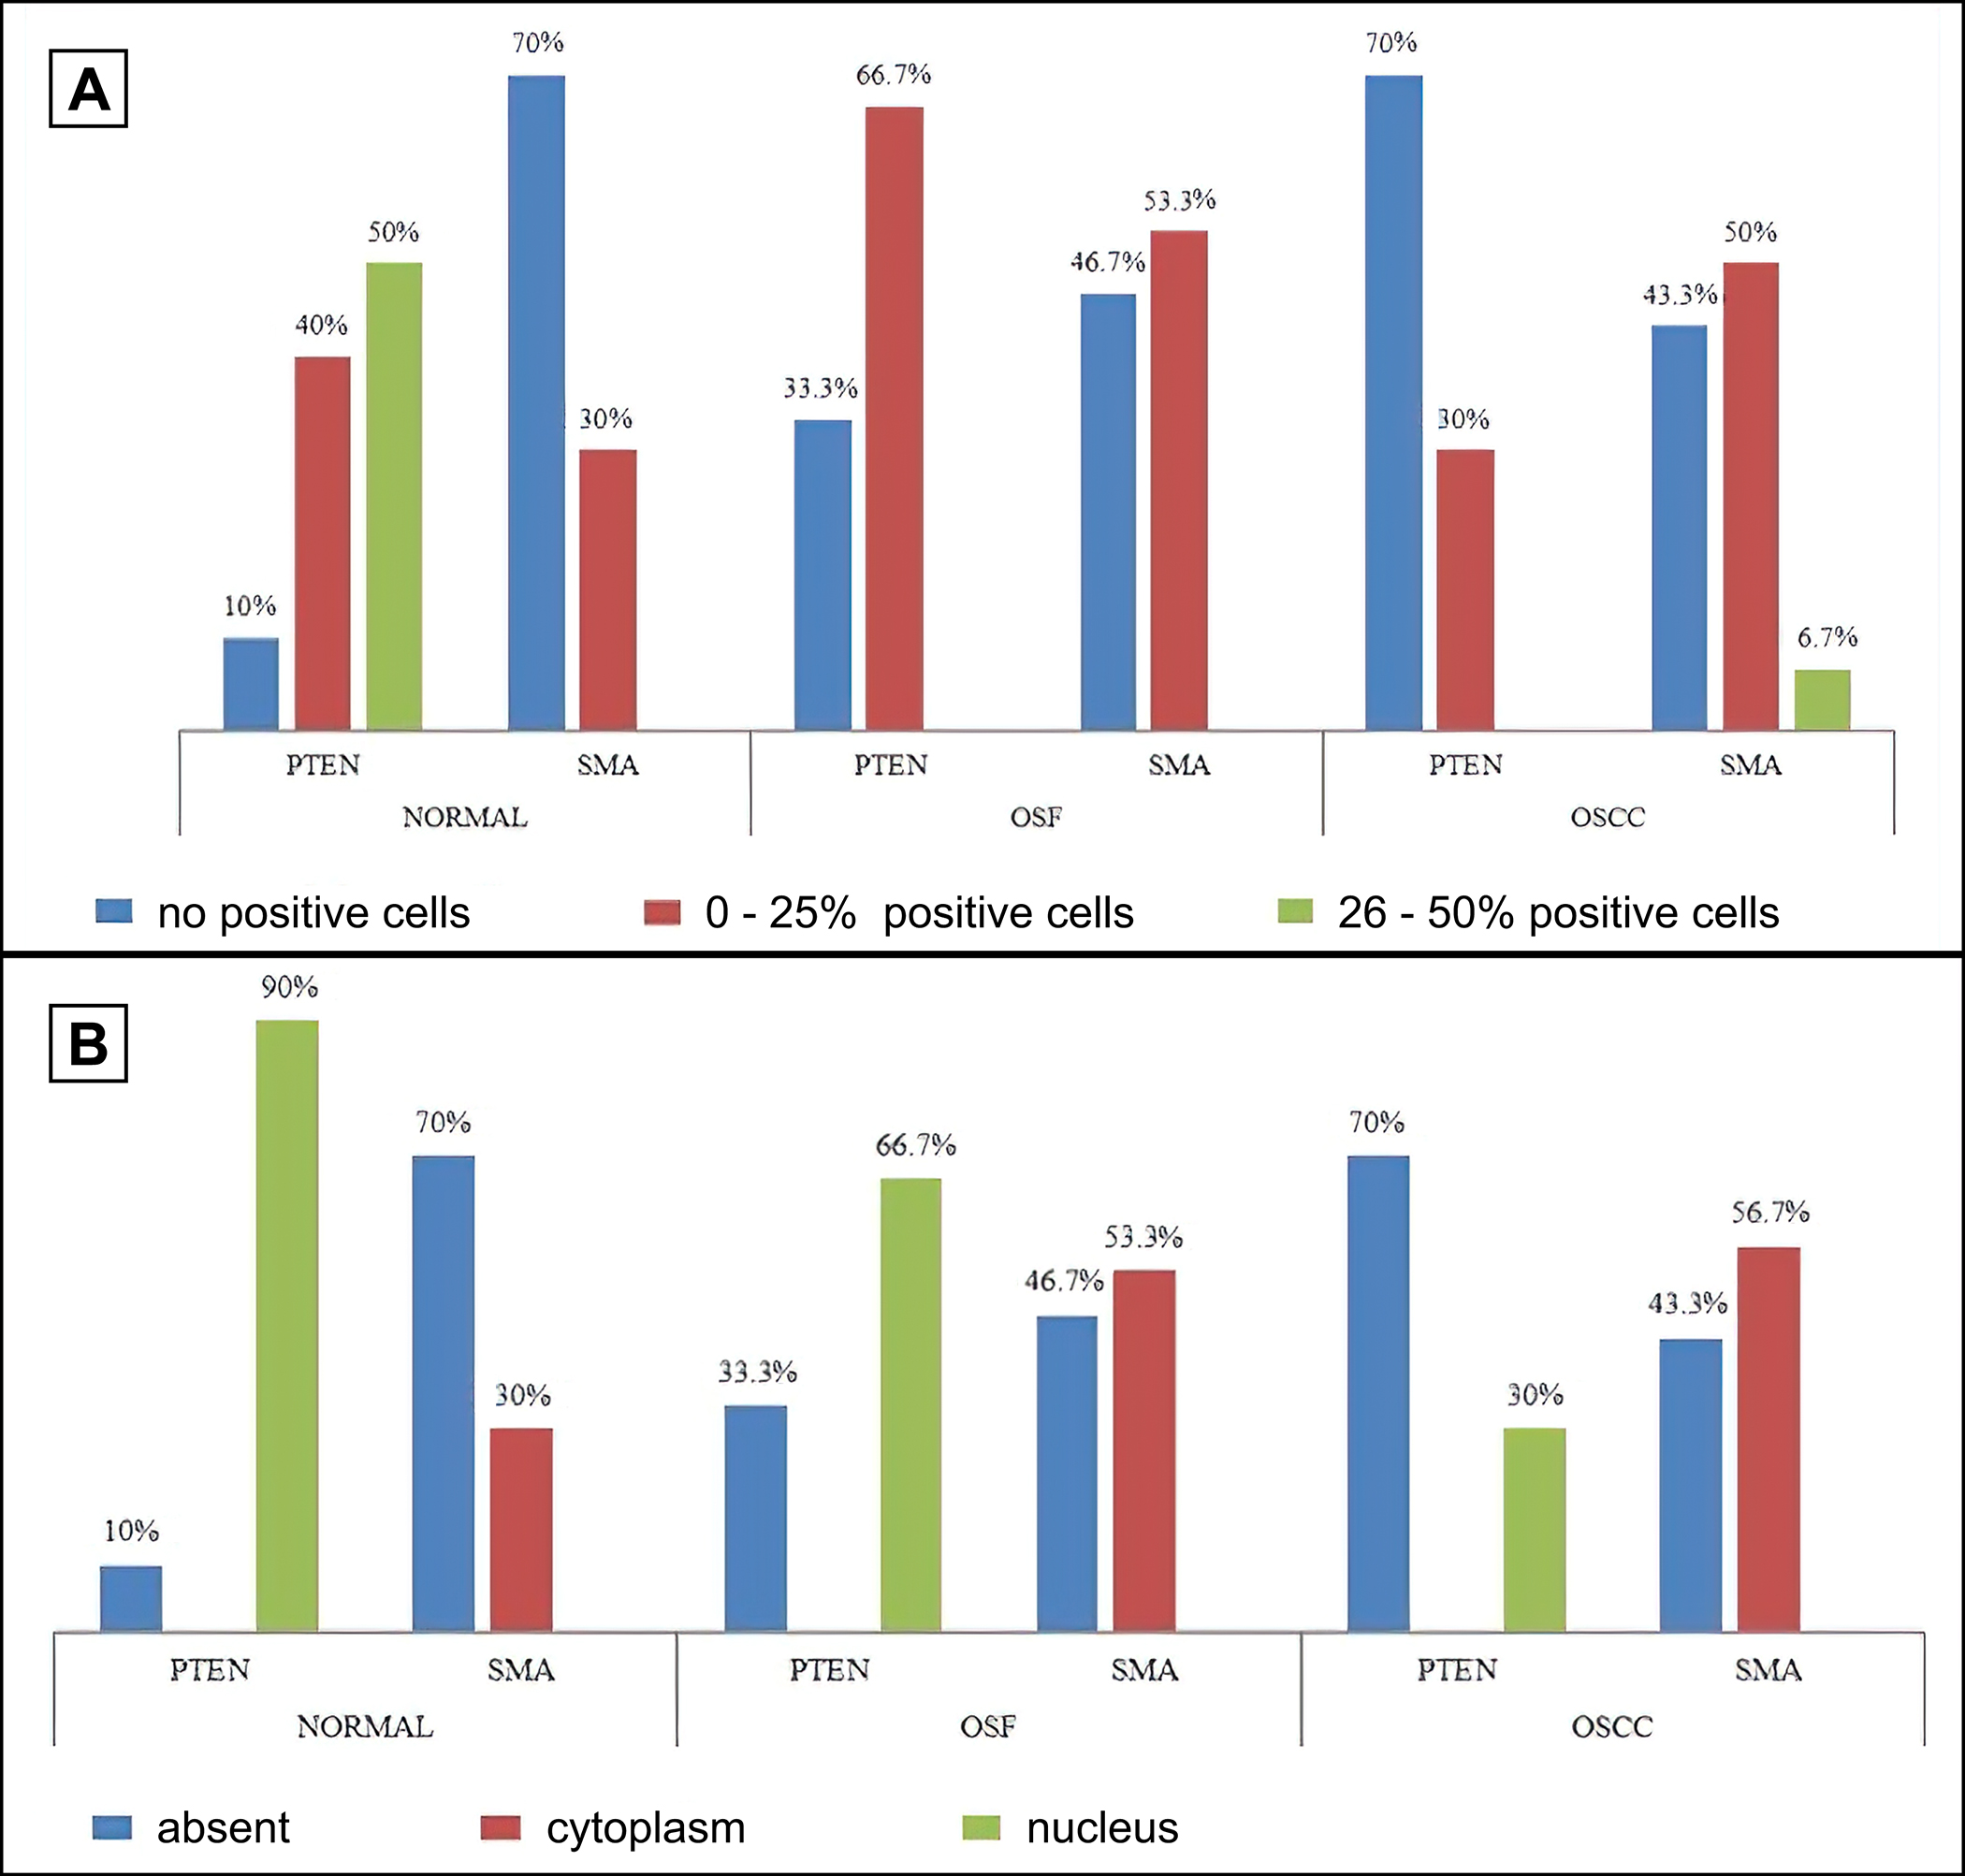
Figure 5.
A = comparison of percentage positivity of phosphatase and tensin homologue and alpha-smooth muscle actin. B = comparison of distribution of pattern of phosphatase and tensin homologue and alpha-smooth muscle actin.
.jpg "View Figure")
.jpg "View Figure")
.jpg "View Figure")
.jpg "View Figure")
.jpg)