Figure 2. | Changes in anxiety scores following cone-beam computed tomography (CBCT) imaging for Group A and Group B. |
.jpg "View Figure")
Figure 1.jpg)
Figure 2
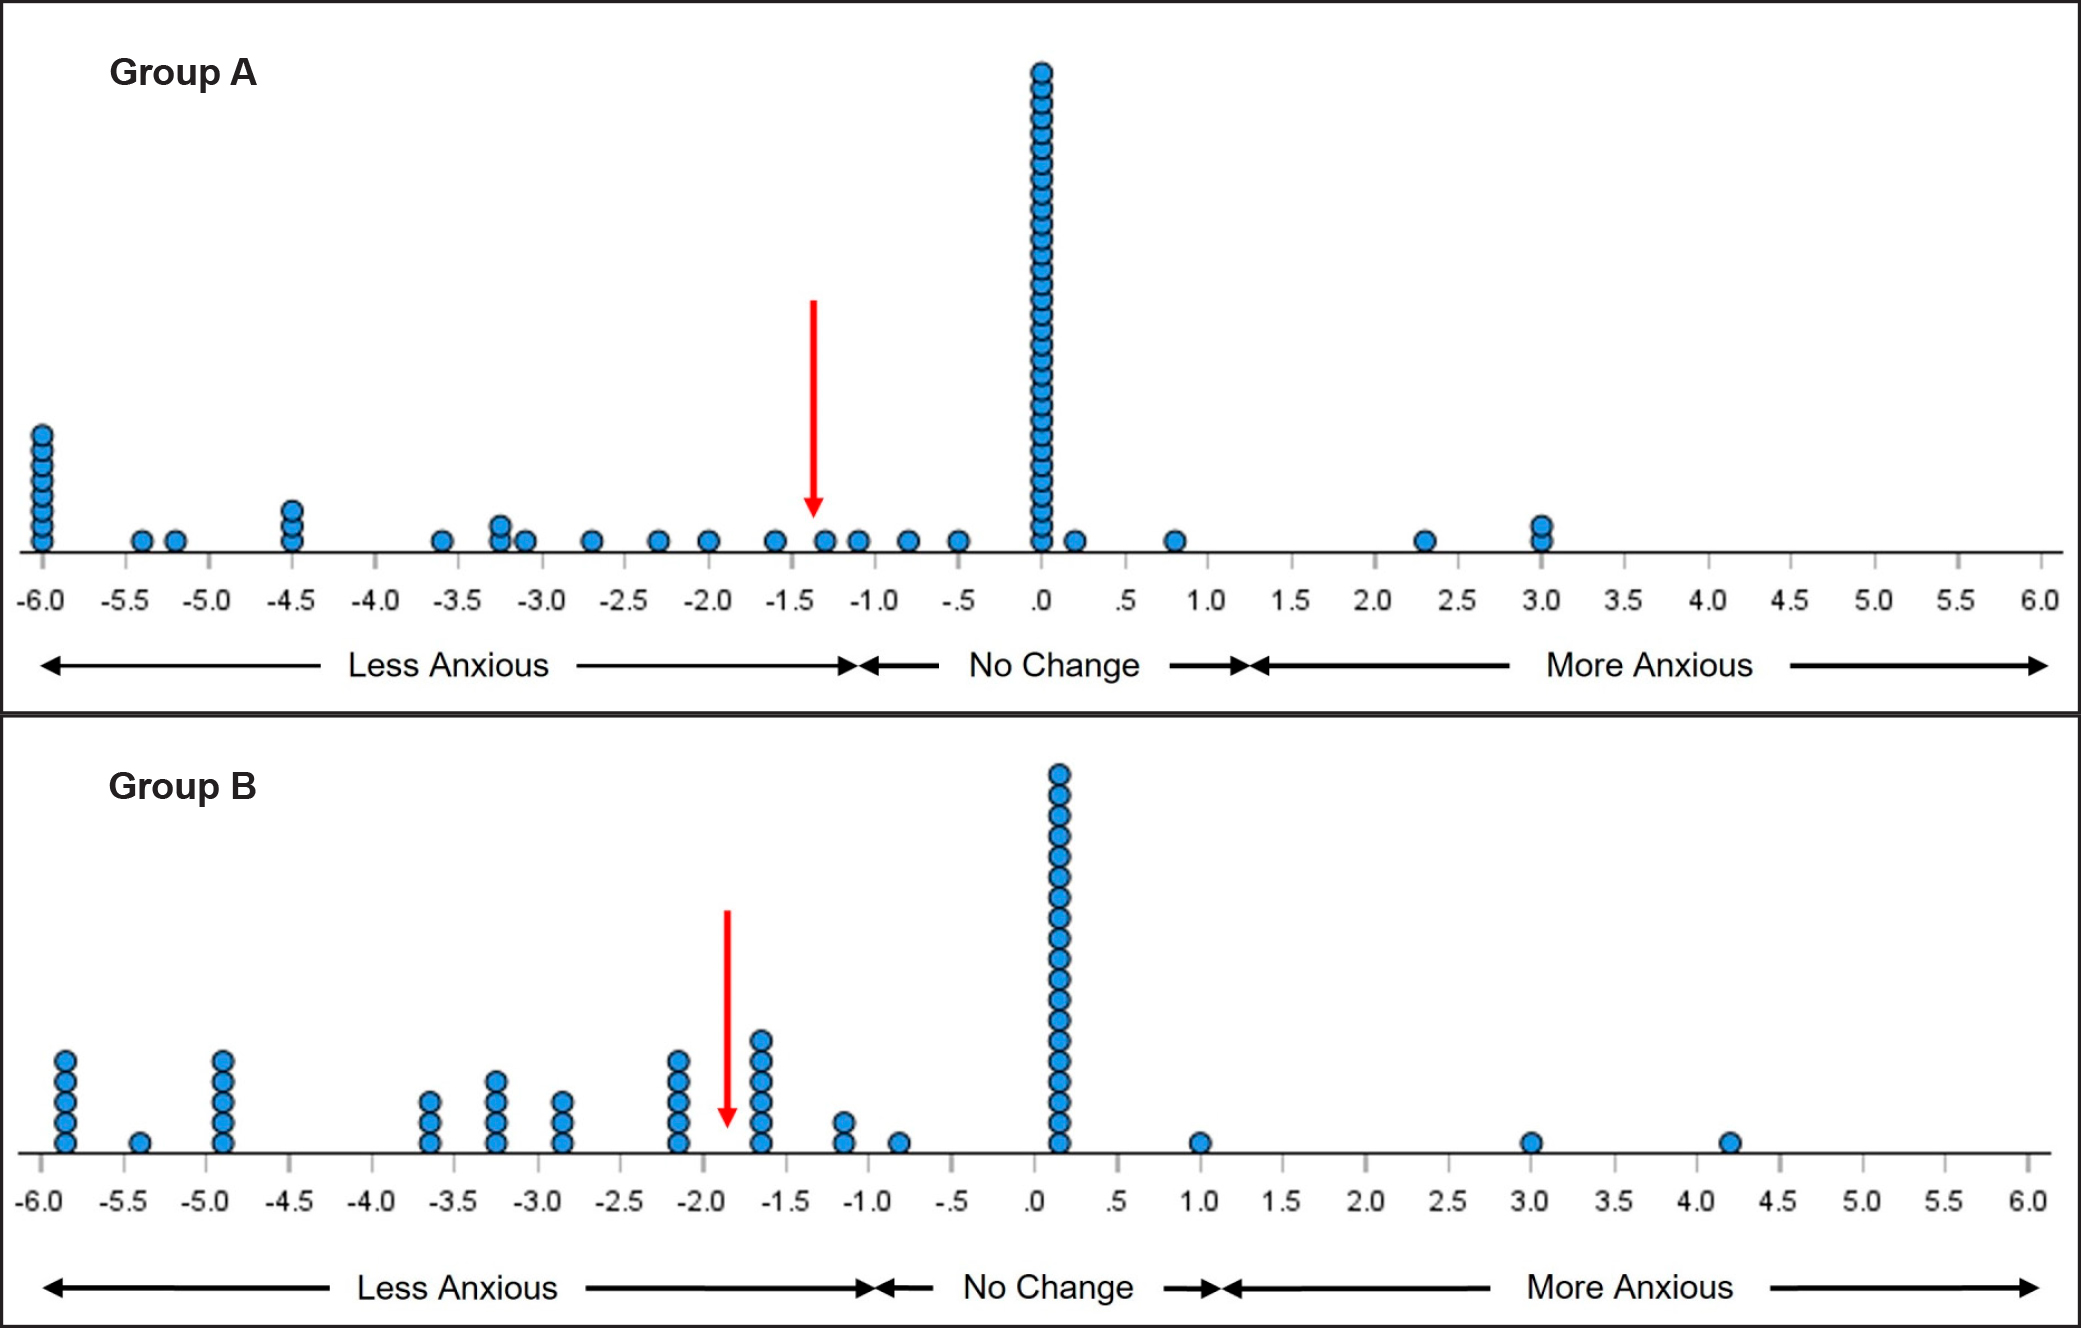
Dot plots illustrating individual changes in patient-reported anxiety scores pre- and post-CBCT imaging in Group A (top) and Group B (bottom). Each blue dot corresponds to an individual participant's response. The X-axis denotes anxiety level change. Negative values indicate reduced anxiety, positive values indicate increased anxiety, and zero reflects no change. The red arrow marks the mean change in anxiety score for each group. A greater leftward shift in Group B suggests a stronger anxiety reduction effect in this group. |