Figure 2. | Illustration of the photometric assessment. |
.jpg "View Figure")
.jpg)
.jpg "View Figure")
.jpg "View Figure")
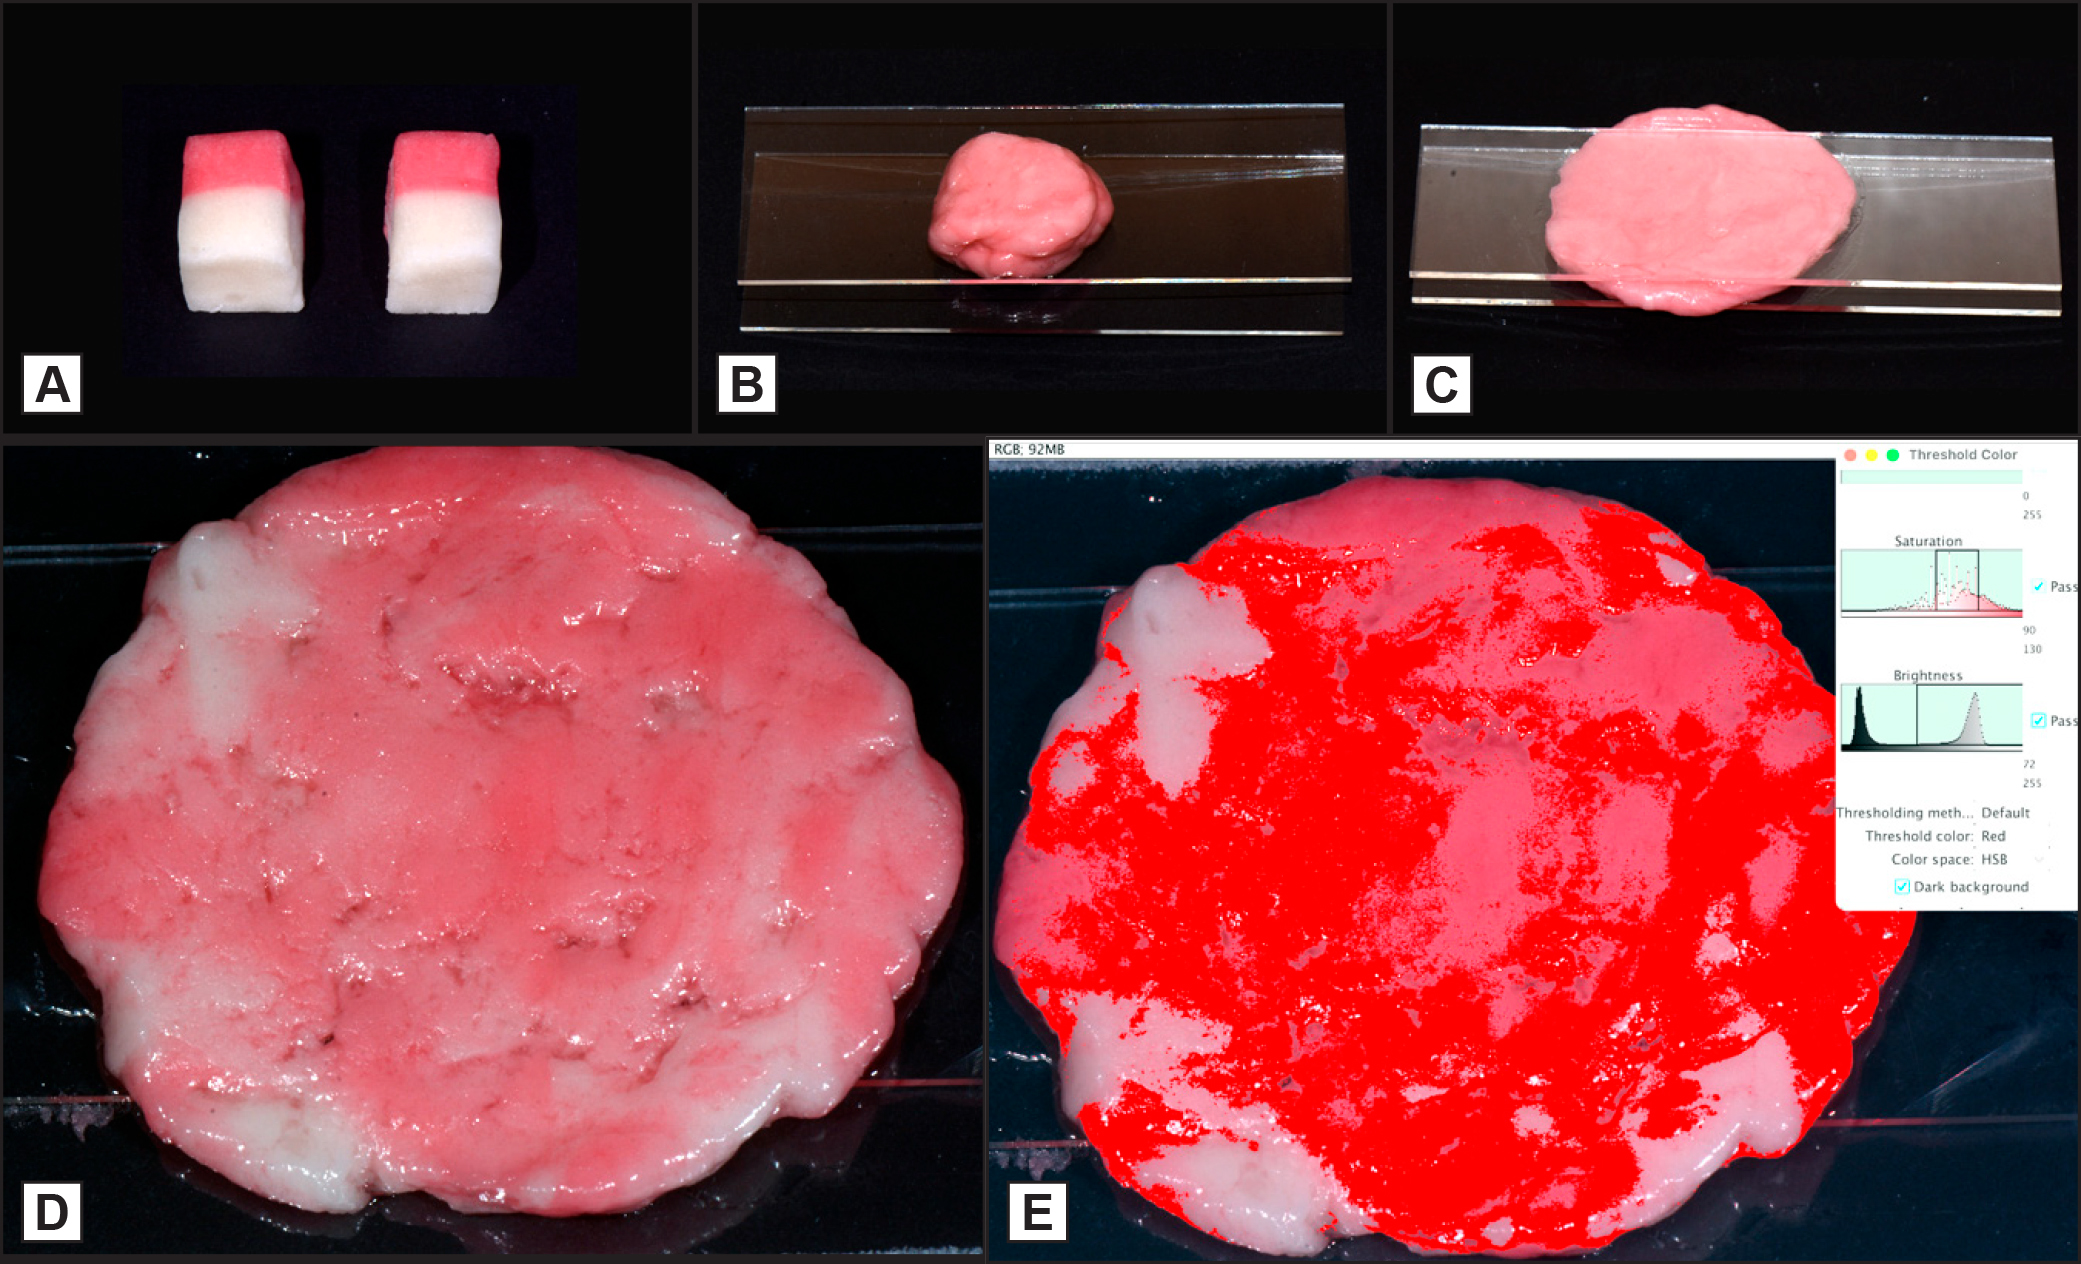
A = two colour chewing gum divided in 2 equal pieces; B = chewing gum placed between 2 glass slides after mastication; C = chewing gum pressed between two glass slides to obtain a 2 mm-thick specimen; D = the photograph of the specimen that will be imported to the ImageJ® (Fiji distribution; National Institute of Health) software for further analysis; E = analysis of the blended colour percentage. |