Figure 4. | Representative images comparing gland parenchyma of untreated control (A) and treated gland (B) from the same rat from Group A. |
.jpg "View Figure")
.jpg "View Figure")
.jpg "View Figure")
.jpg)
.jpg "View Figure")
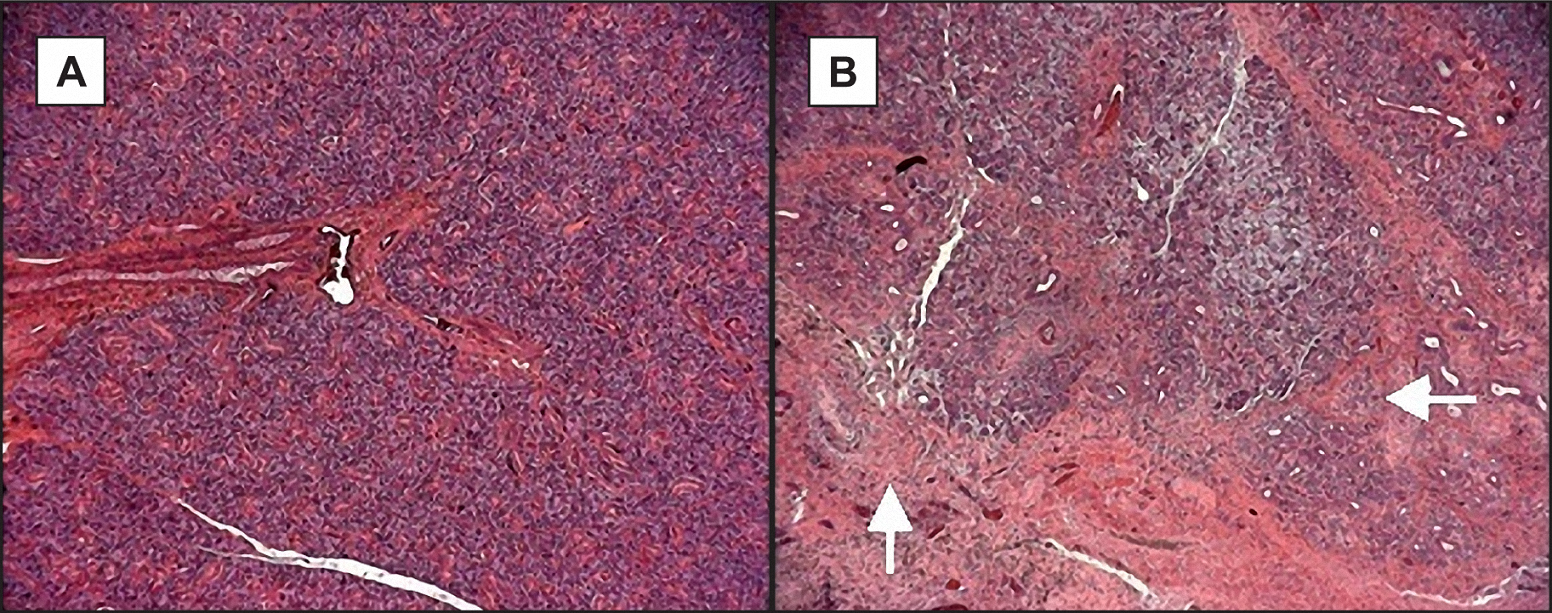
Treated glands demonstrate noticeably decreased acinar density and increased connective tissue.
|
Figure 4. | Representative images comparing gland parenchyma of untreated control (A) and treated gland (B) from the same rat from Group A. |